An experimental Archive Explorer is now available to view past seasons.
May 2025:
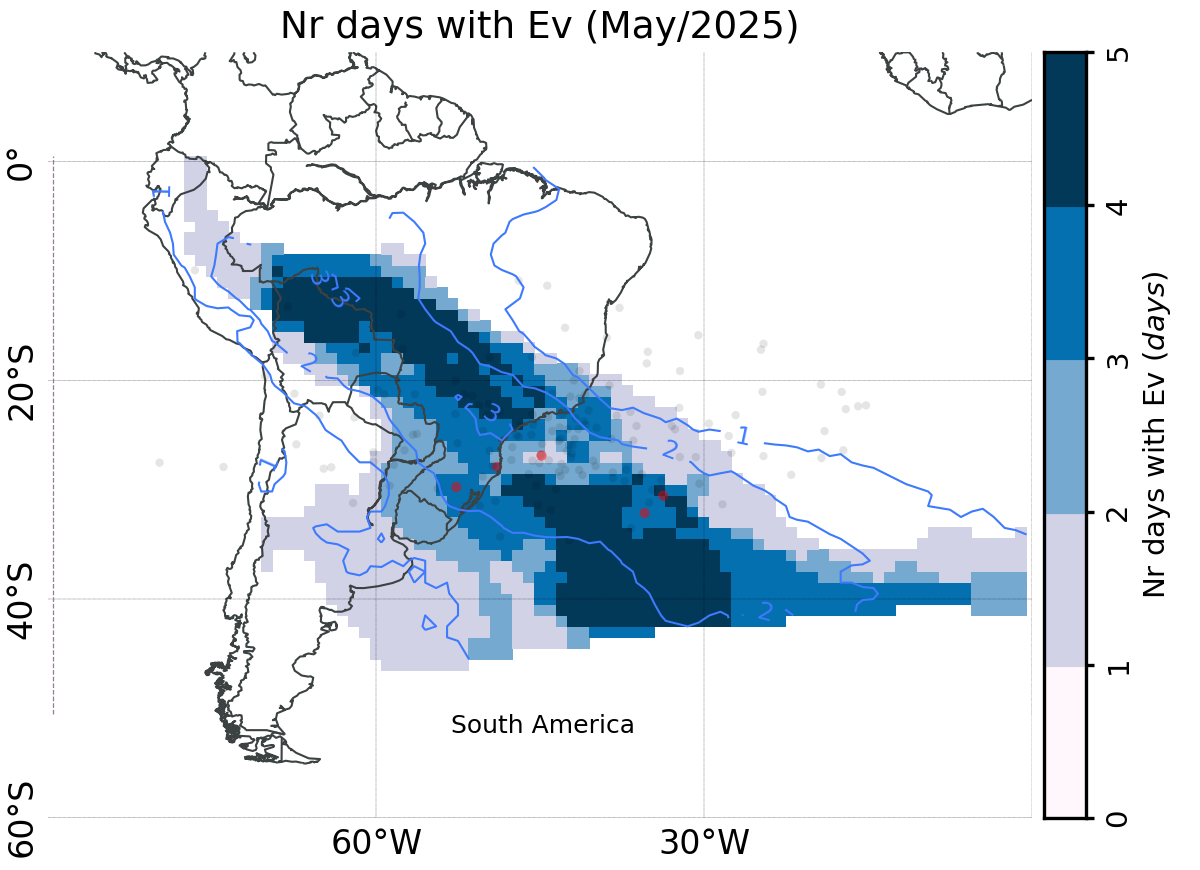
Latest monthly gridpoint accumulation
Accumulation of cloud band days at grid-points for last month, with red dots indicating centroid of observed cloud bands.
Blue contours show climatological value of cloudband days count.
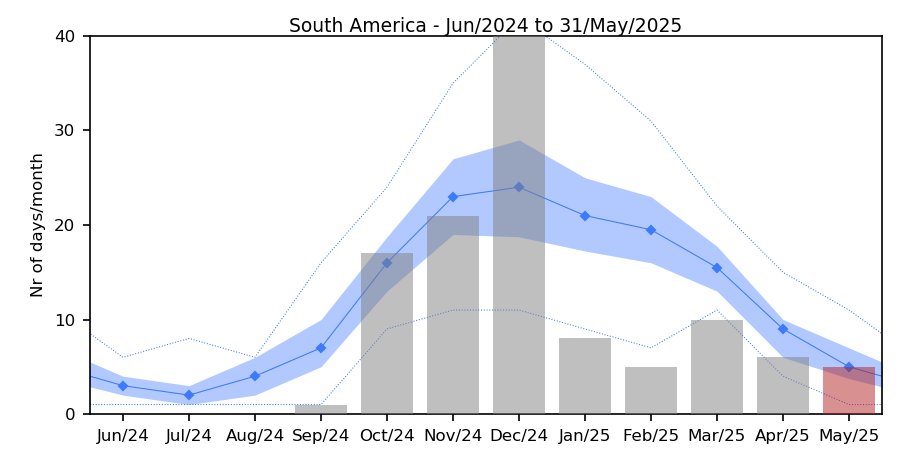
Seasonal progression of cloudband days
Monthly cloudband days for last year (grey bars) including latest month (red bar). Climatological cloudband days per month
shown in blue line, which blue shading denoting interquartile range of climatology.
interquartile range
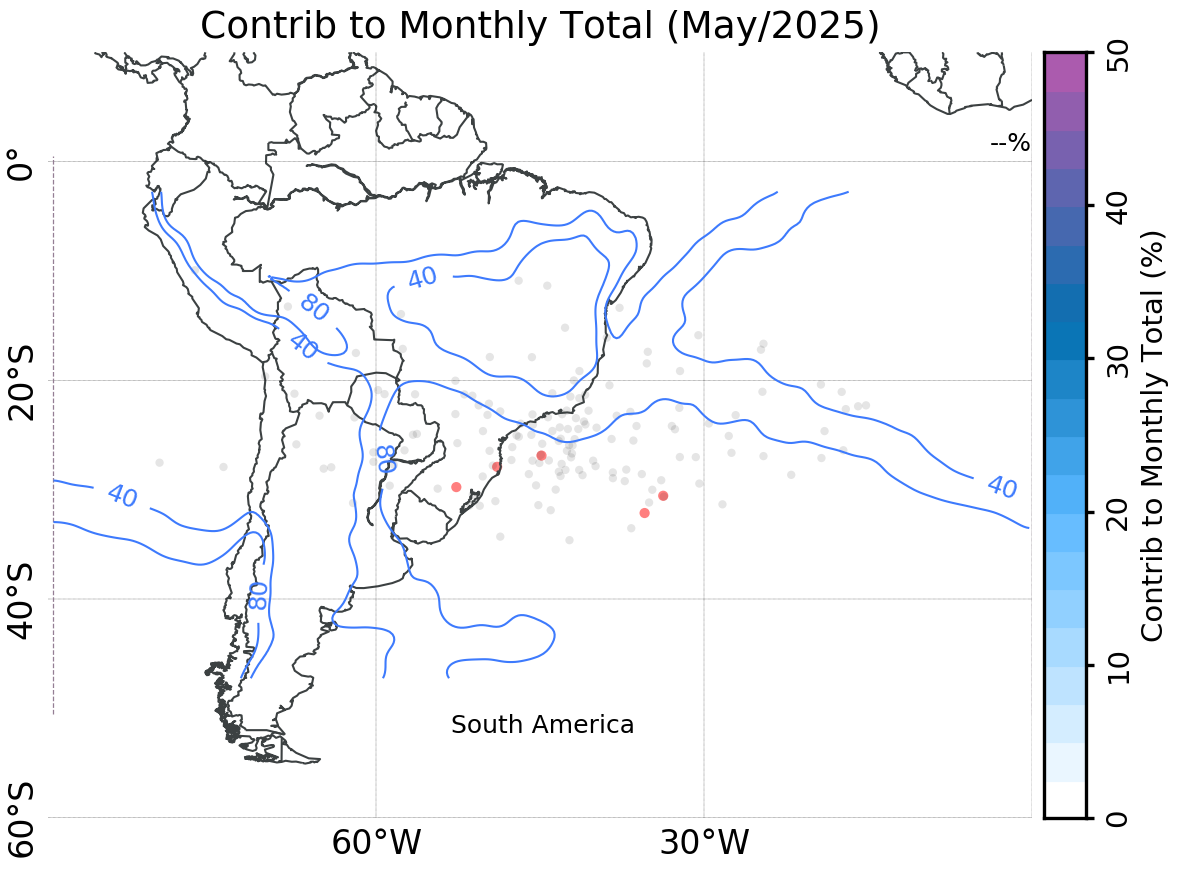
Rainfall contributions of cloudbands
Contribution (%) of cloud band events to monthly total rainfall (contour).
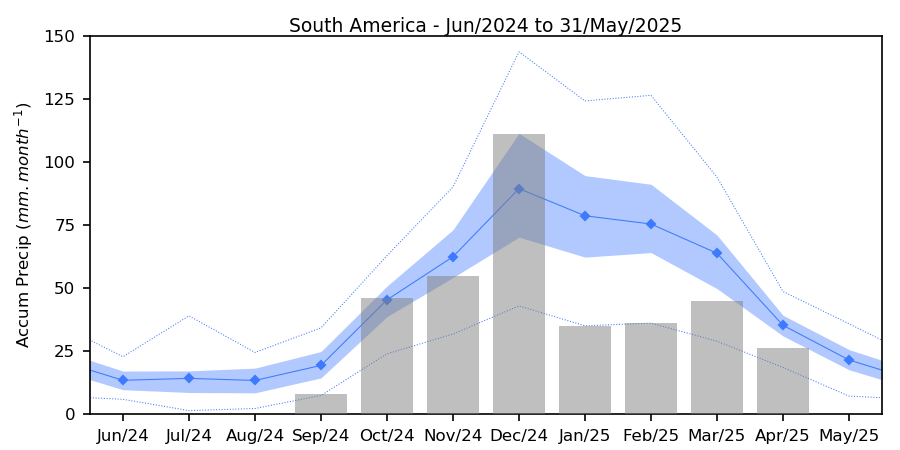
Monthly area-averaged cloudband rainfall totals for sector compared to climatological cloudband rainfall monthly totals.