What and Why?
The subtropical convergence zones of the Southern Hemisphere are constituted at the synoptic-scale by frequent bands of deep cloud which link the tropics to the extratropics. These tropical-extratropical cloud bands form along the leading edge of upper-level westerly waves which propagate into the subtropics, and are responsible for major contributions to the rainfall climatology of the subtropics. This website will be updated regularly to monitor the progress of the cloudband season.
How?
This near real-time monitor applies an automated tropical-extratropical cloudband identification algorithm (MetBot, Hart et al 2012) to the near real-time Daily Mean Outgoing Longwave Radiation (OLR) Climate Data Record (CDR) maintained by Hai-Tien Lee, NCEI. The algorithm has been extensively validated using this data set over southern Africa (Hart et al 2013, 2018a), South America (Zilli & Hart 2021), and in application to climate model data (Hart et al 2018b, James et al 2020). Here, the algorithm is extended to the whole Southern Hemisphere to monitor the evolution of the cloud band season (typically through the austral summer).
The algorithm operates as follows:
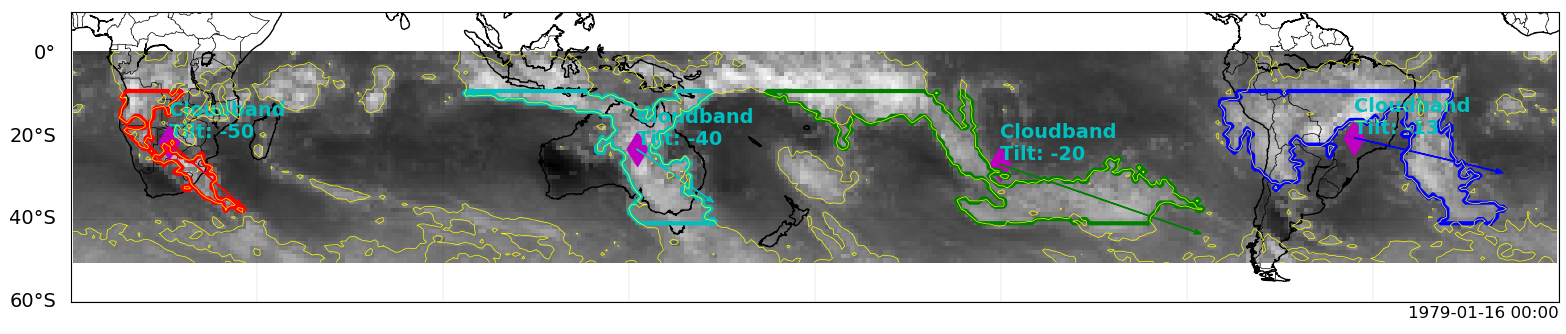
- Segment a daily mean OLR image for the Southern Hemisphere by an appropriately chosen OLR threshold. 230W/m2 is used here for hemispheric scale monitoring.
- Identify large contiguous blobs in this segmented image. Then filter these blobs for:
- Latitudinal extent from at least 15oS to 40oS.
- An orientation angle that corresponds to a general NW-SE tilt of the cloud band.
- Flag cloud bands when 3. & 4. are true and retain properties of these contiguous blobs including outline contour, centroid, tilt angle, and OLR properties. An example of such flagged events overlayed on the raw OLR field is shown in the first figure above.
- Sort through flagged cloudband days database to collate into multiday events where flagged blobs on consecutive days are co-located.
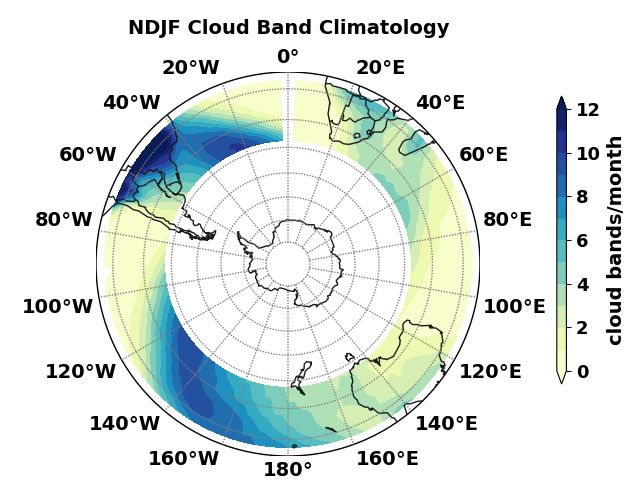
The resulting eventset of TE cloud bands is used to produce the realtime spatial maps showing number of days grid-points have an overlying cloud bands and seasonal cycle plots of number of cloudband events or cloudband days per month. These plots are compared to the satellite-era climatology computed from the whole NCEI OLR CDR dataset. In this way, up-to-date estimates are provided of the latest cloudband count data relative to climatological expectation.
Data Sources
1. Near real-time Daily Mean Outgoing Longwave Radiation (OLR) Climate Data Record (CDR) maintained by Hai-Tien Lee, NCEI.
2. Integrated Multi-satellitE Retrievals for GPM (IMERG) Rainfall Data. Specifically, IMERG Late Run data is used owing to near real-time availability. Starting October 2024, plots have been updated to use IMERG v7 data.
NCEI and NASA are gratefully acknowledged for making this data freely available and in near real-time.
Feedback
This is the beta version website and is subject to updates and improvements.
Please get in touch with any suggestions or plots you would like to see displayed.
Neil Hart: neil dot hart @ ouce dot ox dot ac uk
Marcia Zilli: marcia dot zilli @ ouce dot ox dot ac uk
Supporting publications
Zilli, M. & Hart N.C.G (2021) Rossby wave dynamics over South America explored with automatic Tropical-Extratropical cloud band identification framework, J. Climate, EOR, https://doi.org/10.1175/JCLI-D-21-0020.1
James, R., N.C.G. Hart, C. Munday, C.J.C Reason, and R. Washington (2020) Coupled climate model simulation of Tropical-Extratropical Cloud Bands over southern Africa J. Climate, 33:8579-8602, https://doi.org/10.1175/JCLI-D-19-0731.1.
Hart, N.C.G, R. Washington, and C.J.C Reason (2018) On the likelihood of tropical-extratropical cloud bands in the South Indian Convergence Zone during ENSO events. Journal of Climate, 31 (7) pp. 2797-2817, https://doi.org/10.1175/JCLI-D-17-0221.1.
Hart, N.C.G, R. Washington, and R. A Stratton (2018) Stronger local overturning in convective‐permitting regional climate model improves simulation of the subtropical annual cycle. Geophysical Research Letters, 45, 11334–11342, https://doi.org/10.1029/2018GL079563.
Hart, N.C.G., C.J.C. Reason, and N. Fauchereau (2013) Cloud bands over southern Africa: seasonality, contribution to rainfall variability, and modulation by the MJO. Climate Dynamics, 41 (5-6). pp. 1199-1212. DOI: 10.1007/s00382-012-1589-4
Hart, N.C.G., C.J.C. Reason, and N. Fauchereau (2012) Building a tropical-extratropical cloud band metbot. Monthly Weather Review, 140 (12). pp. 4005-4016. 10.1175/MWR-D-12-00127.1